Establishing the Foundation for PET Scanning: the 2-Deoxyglucose Method, 1968-1978
Although focused on the thyroid and protein synthesis work for over a decade, Sokoloff had not lost interest in tracking local cerebral metabolism via glucose metabolism. In the late 1950s, other researchers had discovered a glucose analog, 2-deoxyglucose (2-DG), which behaves just like glucose in the first step of the ten-step metabolic pathway of glycolysis. Like glucose, it is phosphorylated by the enzyme hexokinase, forming 2-DG-6-phosphate rather than glucose-6-phosphate. However, in the second step, the next enzyme (6-glucose-phosphate isomerase) converts the 6-glucose-phosphate to fructose-6-phosphate, but cannot convert the 2-DG-6-phosphate. Because it can't go any further along the pathway, 2-DG-6-phosphate accumulates in the tissue. When Sokoloff learned of this, he realized that radioisotope-labeled 2-DG might be used to trace local cerebral glucose metabolism. A former NIH colleague, Martin Reivich, offered to collaborate with him on working up a method for using 14C-labeled 2-DG. They derived an equation, based on Kety's blood-flow model, that allowed the calculation of local glucose utilization, but it required information on local blood flow and other variables that was very difficult to obtain. The project stagnated for a few years until Sokoloff was able to conceive a new model.
In 1968, Sokoloff took a one-year sabbatical from NIH and worked with Jacques Nunez and Jacques Pommier at the Collége de France in Paris. The team studied several enzymatic reactions designed to elucidate part of the complex chemical pathway of thyroid hormone synthesis in the thyroid gland. While doing this research, Sokoloff developed considerable facility with enzyme kinetics methods, which measure the reaction rates of chemical reactions catalyzed by enzymes. And he realized that a new model, based on enzyme kinetic principles rather just on blood flow and principles of tissue-blood exchange, might be the key to developing a useable [14C] 2-DG method. When he returned to NIH, he finished up his thyroid hormone work, reorganized his laboratory, and began developing a new enzyme kinetic model for using 2-DG to measure local cerebral glucose utilization.
Sokoloff's earlier work with autoradiographic images had inferred metabolic activity from blood flow patterns observed under various conditions. With his new 2-DG method, he hoped to track metabolic activity more directly, by following the 2-DG tracer through that first hexokinase-catalyzed step of glucose breakdown, measuring how much 2-DG-6-phosphate got trapped in the tissue (because 2-DG won't metabolize any further), and use it to calculate how much glucose had been broken down. It had been shown that in the brain two molecules of glucose are normally converted into glucose-6-phosphate for every molecule of 2-deoxyglucose converted to 2-DG-6-phosphate. Thus, it is possible to calculate from the rate of 2-DG conversion how many molecules of glucose must have passed through the hexokinase step of the pathway in the same time interval. Over several years, Sokoloff and his team developed an operational mathematical model that allowed them to calculate the rate of glucose consumption by measuring the concentration of the trapped deoxyglucose product (2-DG-6-phosphate labeled with 14C) in the in brain tissue (as revealed by the autoradiograph images) and dividing by a complex function which incorporates glucose and 2-deoxyglucose levels in the blood plasma, and a numerical constant which reflects chemical characteristics of the metabolizing enzyme in the brain tissues of the specific species studied, for example, rat or monkey. The mathematical model was refined as the researchers gained experience with the method.
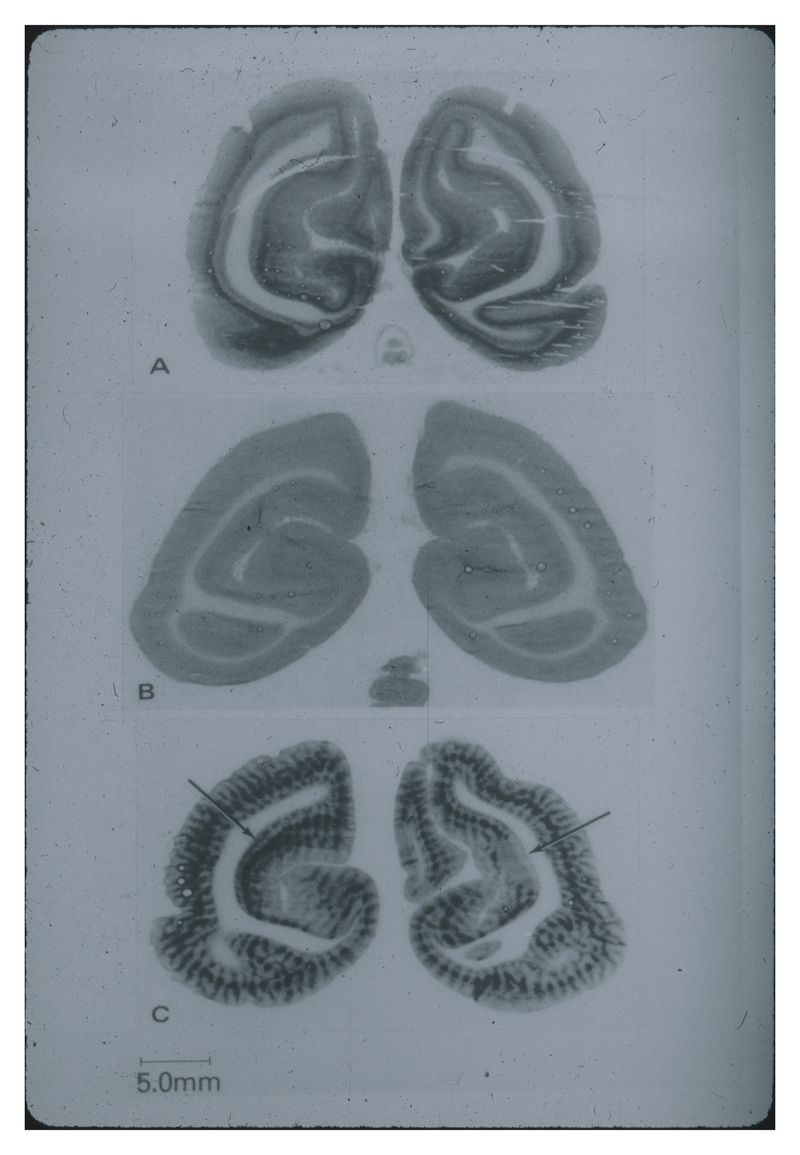
Initially, however, the team didn't know for sure whether local energy metabolism was linked to local functional activity in nervous tissues as in other tissues, and if it was, whether the 2-DG method could pinpoint regions of altered functional activity on the basis of altered metabolism. For several years, therefore, they carried out a series of animal experiments in which they activated or depressed specific regions in the nervous system, tracked the 2-DG metabolism via autoradiograms of brain sections, and verified the results against older data gleaned from neuroanatomical and EEG studies. As Sokoloff later noted, "The results of such studies in auditory, visual, and motor systems provided unequivocal evidence of the linkage between local functional activity and energy metabolism in the nervous system. The effects of altered functional activity on local glucose metabolism were often so pronounced that they could be visualized directly in the autoradiograms without the need for quantification."
The 2-DG method made possible a vast expansion in brain-mapping studies. However, the data generated by the 2-DG method had to be manually analyzed with densitometers, which was time-consuming and limited the number of images that could be assessed. Seeking a way to combine the quantitative strength of the method with the spatial resolution of the autoradiograms, Sokoloff's team collaborated with NIH computer scientists Wayne Rasband and Charles Goochee to develop a computerized image-processing system. The system scanned the autoradiograms with a microdensitometer with a resolution of 50 microns and stored the data in a computer. When supplied with the data on the arterial plasma glucose and 2-DG concentrations, the computer could then solve the operational equation, compute the rate of glucose utilization for each element scanned, and reconstruct the digitized images on a monitor, with the rates of glucose utilization encoded in a calibrated color scale. On the color scale, warmer colors (yellows or reds) represent higher rates of glucose utilization; cooler colors, lower rates. The color, in effect, added a third dimension to the two-dimensional images and displayed the rates of glucose utilization quantitatively exactly where they reside in the brain. The color-coded metabolic maps caused a sensation when first presented at the Society for Neuroscience meeting in 1978. (The NIH administrator who approved the purchase of the computer equipment for this work was less impressed when Sokoloff showed him the colorful brain maps; this puzzled Sokoloff until he learned that the man was color-blind!)
With this computerized enhancement, it was possible to do simultaneous quantitative assessments of metabolic rates in all brain structures simply by looking at the images. Further studies with the 2-DG techniques revealed new relationships between various brain structures, and demonstrated how many of them were activated or inhibited in response to stimulation, or by a given behavior. Sokoloff's group and others also used 2-DG to explore brain metabolism at the cellular level, elucidating the roles played by nerve cells and their support cells (e.g., astrocytes), and the effects of insulin on the process.